Practitioner Research Review – November 2019
Dr. Michael Ruscio’s Monthly – Future of Functional Medicine Review Clinical Newsletter
Practical Solutions for Practitioners
In Today’s Issue
Research
- Dysbiosis or Adaptation: How Stable is the Gut Microbiome?
- Current evidence for the treatment of hypothyroidism with levothyroxine/levotriiodothyronine combination therapy versus levothyroxine monotherapy
- Pesticide exposure and risk of Alzheimer’s disease a systematic review and meta-analysis
- Rapid-Fire Research – Ultra-concise summaries of noteworthy studies
- Breath tests for small intestinal bacterial overgrowth diagnosis: a systematic review with meta-analysis
![]()
Research
*Please note: the case study and research studies are not meant to be mutually reinforcing. There is often concept overlap, however the research studies are a collection of the most clinically meaningful research that has been published recently.
Dysbiosis or Adaptation: How Stable is the Gut Microbiome?
Altern Ther Health Med. 2016 Oct;22(S3):10-12.
Study Purpose
- Explore the cause and effect relationship regarding changes in the intestinal microbiota.
Intervention:
- Commentary/review of data, non-systematic.
Main Results:
- Microbiota mapping test results may show the effect of altered stool consistency and frequency and NOT show the cause.
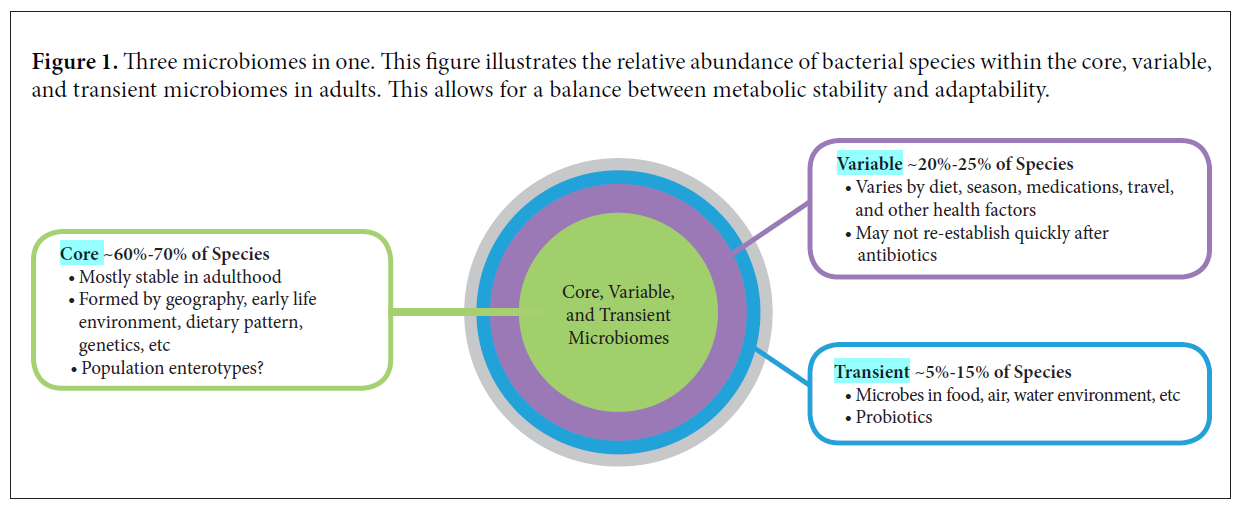
- A portion of the microbiota may normally be variable and may change in adaptation to environment, diet and or pathology.
- There is likely no ideal microbiota
Additional Results:
- A core of species may be very stable over time.
- In general, they have discovered that a fairly large core microbiome (approximately 40 species of bacteria) remains stable in an individual in the course of at least 1 year (1 ).
- In fact, a landmark study published in Science using fecal samples from 37 individuals showed that a person’s “core” gut microbiota is remarkably stable for greater than 5 years (the authors speculate for decades) (2).
- The authors also showed that the core species found in close family members are very similar and that species within the Bacteroidetes and Actinobacteria phyla are more stable than those in other phyla (eg, Firmicutes).
- According to the most comprehensive analysis to date, a myriad of a variable impact the microbiota. Two of the most impactful were use of either antibiotics or laxatives or stool consistency.
- One of the most comprehensive analyses of the core microbiome of adults was published recently by Falony et al (3) called the Flemish Gut Flora Project (FGFP).
- Of the 503 metadata variables that emerged, 69 factors were shown to correlate significantly with overall microbiome community variation.
- Of all the covariates detected, 63% were driven by medication (mostly the use of antibiotics and laxatives), making the use of any medication the largest predefined explanatory variable tested in this study.
- However, when breaking down the covariates into smaller categories, stool consistency as measured by the Bristol Stool Scale (BSS) emerged as the top single nonredundant microbiome covariate in the FGFP metadata
- Note: BSS is Bristol stool score
- What does this mean? Well, it is still open to interpretation. I view this to mean we should focus on the health of the individual (and their bowels) FIRST rather than focusing on treating results of microbiota mapping assays. Note: this is the option reflected by leading experts in the field (namely Rob Knight).
- More data supports the posit that we should focus on normalizing stool consistency as a way of improving the microbiota, better consistency = improved species richness.
- The connection between stool consistency and microbiota abundance/diversity has been further analyzed. Vandeputte et al (4) found stool consistency (as measured by BSS) was strongly associated with fecal microbial richness. Species richness was shown to significantly decline as stool firmness declined (P = .0007), reaching its minimum in those with diarrhea.
- Enterotypes (ie: your microbiota type) also correlates with stool consistency and regularity
- The group also found enterotypes were distributed over BSS scores, the Prevotella enterotype was more abundant in looser stools (P = .019), and the Ruminococcaceae-Bacteroides enterotype completely dominated firmer samples (P = .019), perhaps suggesting that enterotypes may be a surrogate marker for bowel transit time because transit time may select for bacteria with certain traits.
- For instance, individuals with a short transit time may have greater amounts of fast-growing bacterial species, whereas those with slow transit times may instead select bacteria with greater adherence to host tissue. (4)

- The above diagram helps to support a few of the below statements. Summarized as: a portion of the microbiota is variable and changes in this variable microbiota may serve as adaptations to environment or pathology, with no consequence to the core microbiota. Note: I have been hinting at this for some time.
- subtle and important changes in the variable commensal microbiome can occur without fundamentally altering the long-term stability of the core species (at least as determined by analysis of fecal microbiota).
- This means differences in fecal microbiota (beyond the core species enumeration and ratio) may reflect adaptations to environmental or pathophysiological changes that can be meaningfully followed in clinical research or in clinical application.
- Last, a significant portion of the microbiota is transient; most comes from our food (including probiotics), water, air, and environment. These microorganisms rarely persist beyond a week or two, but they can be important modulators of both the core and variable microbiome, and they greatly influence host physiology.
Is there an ideal microbiota?
- Here is the author’s answer, in short NO because it is constantly shifting and adapting.
- This is a very tricky question. If the question implies a basic set of microbial species that is ideal for any human subject living anywhere, then the answer is “no.”
- However, we believe there is likely a suitable microbiome for each person, one that is properly adapted to their particular geography, genetics, diet, and environment.
- In fact, if we are correct in understanding the microbiome as the ultimate adaptable organ system, the microbiota within the GI tract (and therefore in the fecal sample) should change with age, with seasonal dietary changes, and with health status
- And as I have claimed numerous times, we shouldn’t look to replicate hunter-gatherer microbiotas
- Comparing the microbiome of Western subjects consuming monotonous and poor diets to the microbiome of hunter-gatherers eating seasonally shows dramatic differences. Although some would describe the microbiota of these hunter-gatherers as ideal, it probably would be poorly sustained and suited to benefit the Western subject eating a standard Western diet.
- The gut microbiota adapts to various GI disorders
- As we shall see, general changes in the fecal microbiota are indicative of certain GI disorders (when compared with “healthy” control individuals). Some of these alterations reflect wholesale changes at the phylum level, whereas others are subtle changes in 1 or 2 species.
- Namely, GI immune dysfunction can lead to an altered GI microbiota
- New research now suggests that in some patients, the immune system can misinterpret a “normal” microbiome as “dysbiotic” due to genetic polymorphisms in a variety of immune receptors tasked with interpreting the gut microbial environment (5).
- certain commensal organisms may trigger an inappropriate response when the host immune system misinterprets their molecular pattern as “pathogenic” (eg, inflammation, autoimmune, cross-reactivity).
- This can result in genetically-induced dysbiosis
- … can result in dysfunctional immune regulation of the commensal organisms within the gut (eg, reduced levels of secretory immunoglobulin A to target pathobionts). This lowers the precision of the immune surveillance within the GI tract, allowing for an imbalance in the commensal organisms, creating a host-derived genetics-induced dysbiosis (6).
Clinical Takeaways:
- Microbiota mapping tests, although interesting, are not clinically actionable because they tell more about effect than cause. Also, because results are highly variable.
- There is not an ideal microbiota.
- Focusing on the health of the patient (namely their stool consistency, frequency and ostensibly their overall health/symptoms) should be the primary focus – and not treating the results of a microbiota assay.
- What to tell your patients:
- We will focus on testing for clinically actionable findings, for example, SIBO and pylori, instead of mapping your microbiota – which unfortunately is not clinically actionable, despite what internet gurus proclaim.
- One of the most powerful actions we can take to improve your microbiota is to improve your stool frequency and consistency.
Dr. Ruscio Comments
The above sums it up. In short, save your patients time and money and skip the microbiota mapping.
Current evidence for the treatment of hypothyroidism with levothyroxine/levotriiodothyronine combination therapy versus levothyroxine monotherapy
Int J Clin Pract. 2018 Feb;72(2). doi: 10.1111/ijcp.13062. Epub 2018 Jan 30.
Study Purpose
- Assess if combination therapy (T4+T3) should be routinely recommended for hypothyroid patients.
Intervention:
- Review of data (17 studies) from the past 50 years, non-systematic.
Main Results:
- When using T4, 5-10 % of patients will still have symptoms even after achieving normal TSH.
- Approximately 5%-10% of patients who normalize thyroid-stimulating hormone levels with LT4 monotherapy may have persistent symptoms that patients and clinicians may attribute to hypothyroidism.
- “Current clinical evidence is not sufficiently strong to support LT4/LT3 combination therapy in patients with hypothyroidism.”
- Symptomatic non-responsiveness to T4 therapy could indicate another underlying issue that should be investigated. Note: Dr. Joe Mather’s recent case study illustrated this.
- “Persistent symptoms in patients who are biochemically euthyroid with LT4 monotherapy may be caused by several other conditions unrelated to thyroid function, and their cause should be aggressively investigated by the clinician.”
- Remember, the best available data support this thinking – the available meta-analyses and/or systematic reviews all conclude there is no benefit to combination therapy. Detailed below:
- In a systematic review of 9 controlled trials that included 1056 patients, no reproducible benefit in mood, QoL or psychometric performance was found with LT4/LT3 combination therapy compared with LT4 monotherapy (58).
- A meta-analysis of 11 randomised trials (N = 1216) found no differences in bodily pain, depression, anxiety, fatigue, cognitive function or QoL outcomes in patients treated with LT4/LT3 combination therapy versus LT4 monotherapy (59).
- In 2007, a meta-analysis of nine controlled studies (N = 1141) also found that there was no significant difference between LT4/LT3 and LT4 therapy in measures of mood, although the authors noted that combined treatment was the preferred treatment in the studies that measured patient preference (no preference, 23%; preference for LT4, 32%; preference for LT4/LT3, 46%) (60).
- The fourth integrated analysis, a meta-analysis of 10 randomised double-blind trials (N = 1153), found nothing but sporadic improvements associated with LT4/LT3 versus LT4 therapy in mood, cognitive function, QoL outcomes or adverse effects. By this analysis, no difference was noted in patient preference between treatment regimens (61).
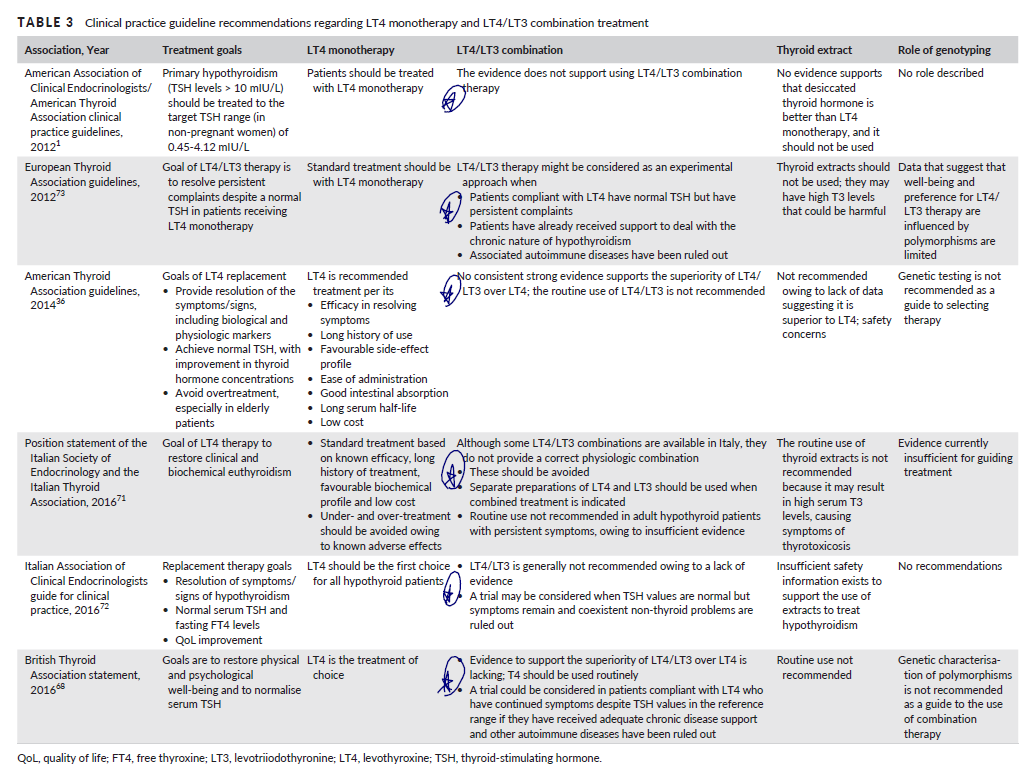
- Summary of global endocrine association’s position statements regarding combination therapy. As you can see, there is agreement that combination therapy does not have sufficient evidence to support its use…

- Other considerations causing symptomatic non-responsiveness


Additional Results:
- Let’s address the statement “But the studies are inadequate, patients need T3!!” Note: You will find some doctors prescribing only T3 for those with low or low normal T3. My answer would be, I remain open but we might run the risk of harming our patients if we dogmatically administer T3…. Case and point below – increased use of antipsychotic drug use in those on T3 therapy as compared to those on T4 alone or those on combination therapy
- A large, long-term observational study with a maximum 17-year follow-up evaluated morbidity and mortality in patients treated with LT3 (n = 400; 327 patients received the LT3 with LT4, and 73 patients received LT3 alone) or LT4 alone (n = 33 955).
- No statistically significant between-treatment differences were observed in the incidences of death, cardiovascular disease, atrial fibrillation, diabetes or fracture outcomes.
- The only difference that reached statistical significance was an increase in the new use of antipsychotic drugs, an effect that was associated with the use of LT3 (adjusted hazard ratio, 2.26 [95% CI, 1.64- 3.11]; P < .01) (67).
- These data suggest that long-term treatment with LT3 is generally safe although the preponderance of long- term experience in the treatment of hypothyroidism involves LT4 monotherapy.
- Age-associated decreases in T3 might be normal. Note: this is very important as I’ve seen a number of cases who were put on thyroid hormone medication solely due to low-normal T3 levels.
- As TSH levels physiologically rise with aging, T3 levels decline to the same extent in those without thyroid disease, whereas T4 levels remain largely unchanged in the healthy elderly (4).
- As we discussed in my recent review, there are data on both sides of this argument, this is why an unbiased overview of the data is crucial
- In initial studies, the D2-ORFa-Gly3Asp polymorphism, but not the D2-Thr92Ala polymorphism, was correlated with lower levels of some circulating thyroid hormones, including plasma T4 and free T4 but not T3 or free T3 (27, 28).
- In an early clinical trial (N = 141), however, no relationship was seen between either D2 polymorphism and neurocognitive outcomes, well-being, or treatment preference in patients randomised to double-blind treatment with LT4 alone or LT4/LT3 combination therapy.
- Despite the above, we should still leave open consideration for combination therapy in select cases – this is not all or none. This may be due to genetically poor converters, though still debatable.
- Suggest combination therapy is helpful: A larger post hoc analysis (30), examined patients (N = 552) receiving stable LT4 monotherapy who either remained on monotherapy or were switched to LT4/LT3 combination therapy for 12 months (31). Despite a large placebo effect in both treatment groups, a small but statistically significant between-treatment difference of 2.3 points on the General Health Questionnaire (GHQ)–12 was seen at 3 months that favoured LT4/LT3 therapy versus LT4 monotherapy in patients with the D2-Thr92Ala polymorphism; however, the difference of 1.4 points at 12 months was not significant. No differences were observed in thyroid hormone levels with LT4/LT3 treatment, however, and, most importantly, the study was underpowered to detect gene- treatment interactions because of the low frequency of this polymorphism in the population (16%) (30).
- Refutes combination therapy is helpful: Most recently, the effects of the D2-Thr92Ala polymorphism were investigated in a cross-sectional study of 12,625 participants from the LifeLines cohort, including 364 (88% female) patients who received LT4 treatment. In both populations, no correlations were noted between the polymorphism and thyroid parameters, health-related quality of life (QoL), cognitive functioning, the presence of metabolic syndrome, or the use of blood pressure or cholesterol-lowering drugs (32).
- Symptoms might not be a reliable gauge for thyroid hormone status. Some evidence suggests that only hoarse voice and muscle cramps are significantly associated. See thyroid questionnaire here
- Several studies that have evaluated associations between patient-reported symptoms and the presence of overt hypothyroidism suggest that symptoms, even in newly diagnosed patients, may not reliably signal the existence of the hypothyroid condition.
- One study found that, on average, patients newly diagnosed with hypothyroidism (n = 76) reported experiencing 30.2% of symptoms from a panel of 17 traditional hypothyroid symptoms, whereas matched euthyroid controls (n = 147) reported experiencing 16.5% of those symptoms, a difference that was significant. However, only two symptoms that were present, hoarse voice and muscle cramps, remained significantly associated with hypothyroidism in multivariate analysis (33).
- The same investigators demonstrated that the percentage of euthyroid and hypothyroid patients presenting with a series of individual symptoms was quite similar, further illuminating the difficulty that clinicians may have in detecting overt hypothyroidism by symptoms alone when confronted with an array of nonspecific complaints (34).
What about hypothyroid and well-being?
- It is debatable if the claim that ‘treated hypothyroid patients have reduced well-being’ is true or due to a confounding variable. The variable being that those with knowledge of having a disease may report reduced well-being.
- A large questionnaire-based study found that levels of psychological well-being were slightly but significantly lower in 597 patients receiving LT4 to correct hypothyroidism compared with 551 age- and sex-matched controls without thyroid disease (mean GHQ-12 score, 12.09 vs 11.39, respectively; mean Thyroid Symptom Questionnaire [TSQ] score, 12.55 vs 11.52) (37). However, the results may have been confounded by inclusion bias; patients receiving LT4 may have associated lower levels of well-being with their diagnosis of thyroid dysfunction and would have been more likely to have responded to a questionnaire investigating symptoms of hypothyroidism (38).
- Other data suggest well-being is not associated with free T3 but instead tracks with TSH and free T4.
- free T4 and TSH levels correlated with psychological well-being in the entire population, as well as in the subset with TSH levels within the normal range. No relationship, however, was observed between free T3 levels and well- being (39).
- Another study found no association, to any thyroid hormone level, and well-being
- No associations were noted between thyroid function test results (including TSH, free T4, total T4, and total T3) and measures of QoL or fatigue (40).
- Leading the authors to conclude “These findings suggested that the non-specific complaints of fatigue or impaired well-being in patients with hypothyroidism are not predictably due to a deficiency of circulating T3 and would not be expected to improve by increasing either the LT4 dose or adding LT3 therapy.”
Limitations:
- There could be an important limitation in the current body of research, which is masking the benefit of combination therapy. Not using a sustained-release T3 could diminish the potential benefit. I remain open here, but skeptical because I have heard some T3-friendly clinicians state you do not need to use a sustained release formula.
- A caveat for all LT4/LT3 combination studies should be noted, however: once-daily dosing of LT3 replacement therapy does not maintain a steady-state physiologic concentration of this molecule. Indeed, once-daily administration of LT3 is associated with peaks and troughs in T3 concentration (62, 63) and serum T3 levels are more stable when patients are treated with LT4 alone compared with T3 alone (64). The use of an alternative LT3 formulations (65) or LT3 dosing 3 times a day may be required to fully evaluate the effectiveness of combination treatment (36, 62, 66).
Authors Conclusion:
- Current clinical evidence is not sufficiently strong to support LT4/LT3 combination therapy in patients with hypothyroidism.
- Persistent symptoms in patients who are biochemically euthyroid with LT4 monotherapy may be caused by several other conditions unrelated to thyroid function, and their cause should be aggressively investigated by the clinician.
Interesting Notes:
- Hypothyroid prevalence in the US is roughly 4.6% – IBS prevalence ranges from 15-20%. Note: This articulates, via prevalence data, how crucial it is for clinicians to be well-versed in GI care.
- Hypothyroidism is a relatively common condition. In the US National Health and Nutrition Examination Survey (NHANES) III, a prevalence of 4.6% was noted in participants ≥ 12 years of age (2).
Clinical Takeaways:
- IBS is more prevalent than hypothyroidism.
- There may be a time/place for combination therapy, but this has been drastically overstated. Perhaps 10% of cases could benefit if being generous.
- No major endocrine body recommends routine use of combination therapy, nor do any of the current meta-analyses or systematic reviews.
- Symptoms do not tightly track with thyroid hormone levels.
- Lowering of T3 levels might be age-associated, lowering with age may be normal.
- If non-responsive to the thyroid hormone, other underlying conditions should be vigorously investigated. In my opinion certainly the GI.
- What to tell your patients:
- Insert any of the above to counter to the invariable barrage of misinformation your patients will present indoctrinated with.
Dr. Ruscio Comments
Our last few case studies have powerfully driven home the real-world proof that if you don’t jump to the thyroid and take care to optimize GI health, you can achieve results where others have failed. This will save your patients much time, money, and suffering.
I have also robustly documented the scientific support that combination therapy is overutilized and hypothyroidism is incorrectly and overly diagnosed. Please share this information with your colleagues as the field is in desperate need of reform here.
Pesticide exposure and risk of Alzheimer’s disease a systematic review and meta-analysis
Sci Rep. 2016 Sep 1;6:32222. doi: 10.1038/srep32222.
Study Purpose
- Assess occupational pesticide exposure and the risk of Alzheimer’s
Intervention:
- Systematic review with meta-analysis, of 7 high-quality observational
- First of its kind.
Main Results:
- “A positive association was observed between pesticide exposure and AD.”
- “Subgroup analyses revealed that high-quality studies tended to show significant relationships.”
- “…the association remained statistically significant even when adjusting for major confounding factors.”
- Note: This is for occupational exposure, be circumspect with how much you infer from this study.
- “most participants were agricultural workers and had been working for most of their lives in agricultural fields where pesticides were widely used.”
- “Potential bias is the major challenge for meta-analyses of observational studies.”
Additional Results:
- Some evidence has found that blood levels of pesticides are measurably different when eating organic versus conventional (1)
- “A prospective cohort study revealed a positive association between pesticide exposure and mild cognitive impairment, suggesting that people with frequent pesticide exposure, such as gardeners and farmers, may have a higher risk of developing AD” (24).
- Thus, some researchers have hypothesized that pesticide exposure is a potential risk factor for AD, and this hypothesis has been further validated by the results of several epidemiological studies (12, 18). Because the results of these studies are controversial, however, meta-analysis is an important method that can be used to reveal trends that may not be evident in a single epidemiological study.
Limitations:
- Again, observational data and in a cohort of occupationally exposed.
Authors Conclusion:
- “The present meta-analysis suggested a positive association between pesticide exposure and AD, confirming the hypothesis that pesticide exposure is a risk factor for AD. Further high-quality cohort and case-control studies are required to validate a causal relationship.”
Interesting Notes:
- “Epidemiological studies have reported a higher prevalence of AD in rural areas than in urban settings. Over the past decades, pesticides have been used to increase the productivity and the specialization of cultures in rural areas (9). Evidence from in-vitro models and animal studies suggests that long-term/low-dose pesticide exposure may lead to the neuronal loss in specific brain regions, resulting in subsequent cognitive impairment, decreased memory and attention, and loss of motor function (10, 11). These neurobehavioral dysfunctions may ultimately lead to AD and other forms of dementia later in life.”
Clinical Takeaways:
- Opting for organic food may protect against neurodegeneration.
- What to tell your patients:
- Eat organic to the best of your ability. Do your best, don’t stress out about limitations with access or eating some conventional foods. If you are limited, focus on avoiding the Dirty Dozen.
Dr. Ruscio Comments
This adds to other similar studies finding ill health associated with occupational exposure. I’m starting in on a review of the evidence regarding non-occupational exposure and neurodegenerative risk. More to follow.
Rapid-Fire Research: Ultra-Concise Summaries of Noteworthy Studies
Breath tests for small intestinal bacterial overgrowth diagnosis: a systematic review with meta-analysis.
https://www.dldjournalonline.com/article/S1590-8658(19)30442-6/fulltext
- Results: Twelve studies, enrolling 630 patients overall were selected
- GBT showed
- sensitivity of 58.3%
- specificity of 83.5%
- LBT had
- sensitivity of 42.0%
- specificity of 70.6%
- Conclusions:
- “Breath tests do not show excellent performances in comparison to the gold standard. However, keeping into account that SIBO is a benign disease that in most cases requires a simple antibiotic therapy, they can be considered as a surrogate test to replace the invasive one. In this context, GBT has better sensitivity and specificity than LBT and, therefore, should be preferred.”
- R’s note:
- There are unquestionably dogmas in the SIBO community. This is a great community, I like to consider myself a part of it, and I generally agree with most positions. However, blindly following lactulose as being the best test is at odds with what the data show. However, you can make the counter-argument that lactulose testing is more accurate when using a time cutoff of 80-90 minutes.
I’d like to hear your thoughts or questions regarding any of the above information. Please leave comments or questions below – it might become our next practitioner question of the month.

Like what you’re reading?
Please share this with a colleague and help us improve functional medicine
Discussion
I care about answering your questions and sharing my knowledge with you. Leave a comment or connect with me on social media asking any health question you may have and I just might incorporate it into our next listener questions podcast episode just for you!