Practitioner Research Review – March 2019
Dr. Michael Ruscio’s Monthly – Future of Functional Medicine Review Clinical Newsletter
Practical Solutions for Practitioners
In Today’s Issue
Research
- Effect of Low-Fat vs Low-Carbohydrate Diet on 12-Month Weight Loss in Overweight Adults and the Association with Genotype Pattern or Insulin Secretion: The DIETFITS Randomized Clinical Trial
- Assessment of Anti-Vinculin and Anti-Cytolethal Distending Toxin B Antibodies in Subtypes of Irritable Bowel Syndrome
- Ferritin & Hypothyroid – Multiple Nutritional Factors and Thyroid Disease, with Particular Reference to Autoimmune Thyroid Disease
- Thyroid Algorithm Update
![]()
Research
*Please note: The case study and research studies are not meant to be mutually reinforcing. There is often concept overlap, however, the research studies are a collection of the most clinically meaningful research that has been published recently.
Effect of Low-Fat vs Low-Carbohydrate Diet on 12-Month Weight Loss in Overweight Adults and the Association with Genotype Pattern or Insulin Secretion: The DIETFITS Randomized Clinical Trial
https://www.ncbi.nlm.nih.gov/pubmed/29466592
Study Purpose
- “To determine the effect of a healthy low-fat (HLF) diet vs a healthy low-carbohydrate (HLC) diet on weight change”
- “and if genotype pattern or insulin secretion are related to the dietary effects on weight loss”
Contextual Notes:
- Gardner was looking to assess how would a healthy version of low-fat compare versus a healthy version of low-carb. Biases exist in previous low-fat diet trials wherein subjects consumed unhealthy carbs, mainly via processed grains.
- He was also looking to examine if insulin sensitivity predicted which diet one might respond best to.
Intervention:
- Randomized, prospective trial, in 609 subjects (481 or 79% completed the trial)
- 12 months on either low-fat or low-carb
- Macronutrient distributions were:
- 48% vs 30% for carbohydrates
- 29% vs 45% for fat
- 21% vs 23% for protein

- The design here was very real world and the subjects were offered adequate coaching
- The protocol included a 1-month run-in period during which participants were instructed to maintain their habitual diet, physical activity level, and body weight. The intervention involved 22 instructional sessions held over 12 months in diet-specific groups of approximately 17 participants per class. Sessions were held weekly for 8 weeks, then every 2 weeks for 2 months, then every 3 weeks until the sixth month, and monthly thereafter. Classes were led by 5 registered dietitian health educators who each taught 1 healthy low-fat class and 1 healthy low-carbohydrate class per cohort. Dietitians were blinded to all laboratory measures and genotype.
- Here are the details of the dietary recommendations and coaching. Essentially subjects where coached to either avoid high-carb or high-fat foods, thus greatly reducing their consumption. Then, they could gradually allow some back in until they felt they had the minimal allowance they felt was doable in the longer term – a sort of elimination-reintroduction (Gardner called this the ‘limbo-titrate method’). This could be perceived as a weakness however it is also very practical for real-world translation – what could and would people actually do.
- Higher priorities for reduction were given to specific foods and food groups that derived their energy content primarily from fats or carbohydrates. For example, the reduction of edible oils, fatty meats, whole-fat dairy, and nuts was prioritized for the healthy low-fat group, whereas the reduction of cereals, grains, rice, starchy vegetables, and legumes was prioritized for the healthy low-carbohydrate group.
- Then individuals slowly added fats or carbohydrates back to their diets in increments of 5 to 15 g/d per week until they reached the lowest level of intake they believed could be maintained indefinitely.
- No explicit instructions for energy (kilocalories) restriction were given.
- Both diet groups were instructed to (1) maximize vegetable intake; (2) minimize intake of added sugars, refined flours, and trans fats; and (3) focus on whole foods that were minimally processed, nutrient dense, and prepared at home whenever possible. Other components of the emphasis on high-quality food for both diet groups are described elsewhere (10).
- “Those assigned to Healthy Low-Fat were instructed to choose whole-grain foods (e.g., rather than whole wheat flour products), including steel cut oats, farro, barley, quinoa, brown rice, and wild rice. Healthy Low-Fat participants were also encouraged to explore and consume a wide range of legumes and beans, fresh fruit, low-fat dairy products, and lean meats. Given that high quality foods can be more expensive than foods that are similar in type but lower in quality, the encouragement to choose quality was framed as a continuum as opposed to an either/or (e.g., for the Healthy Low-Fat participants, organic wheat berries were at the highest level of quality, followed by conventional wheat berries, then whole wheat bread made with a minimal number of ingredients and no additives, then a more conventional whole wheat bread with many ingredients including additives, and, finally, refined white flour bread with many ingredients and additives was considered the lowest end of the quality continuum). In other words, participants were encouraged to choose the highest quality foods that they could reasonably find, realistically afford, and enjoy. “
- “Those assigned to Healthy Low-Carb were instructed to choose high-quality oils and fats, avocados, hard cheeses, nut butters, and nuts & seeds.”
Main Results:
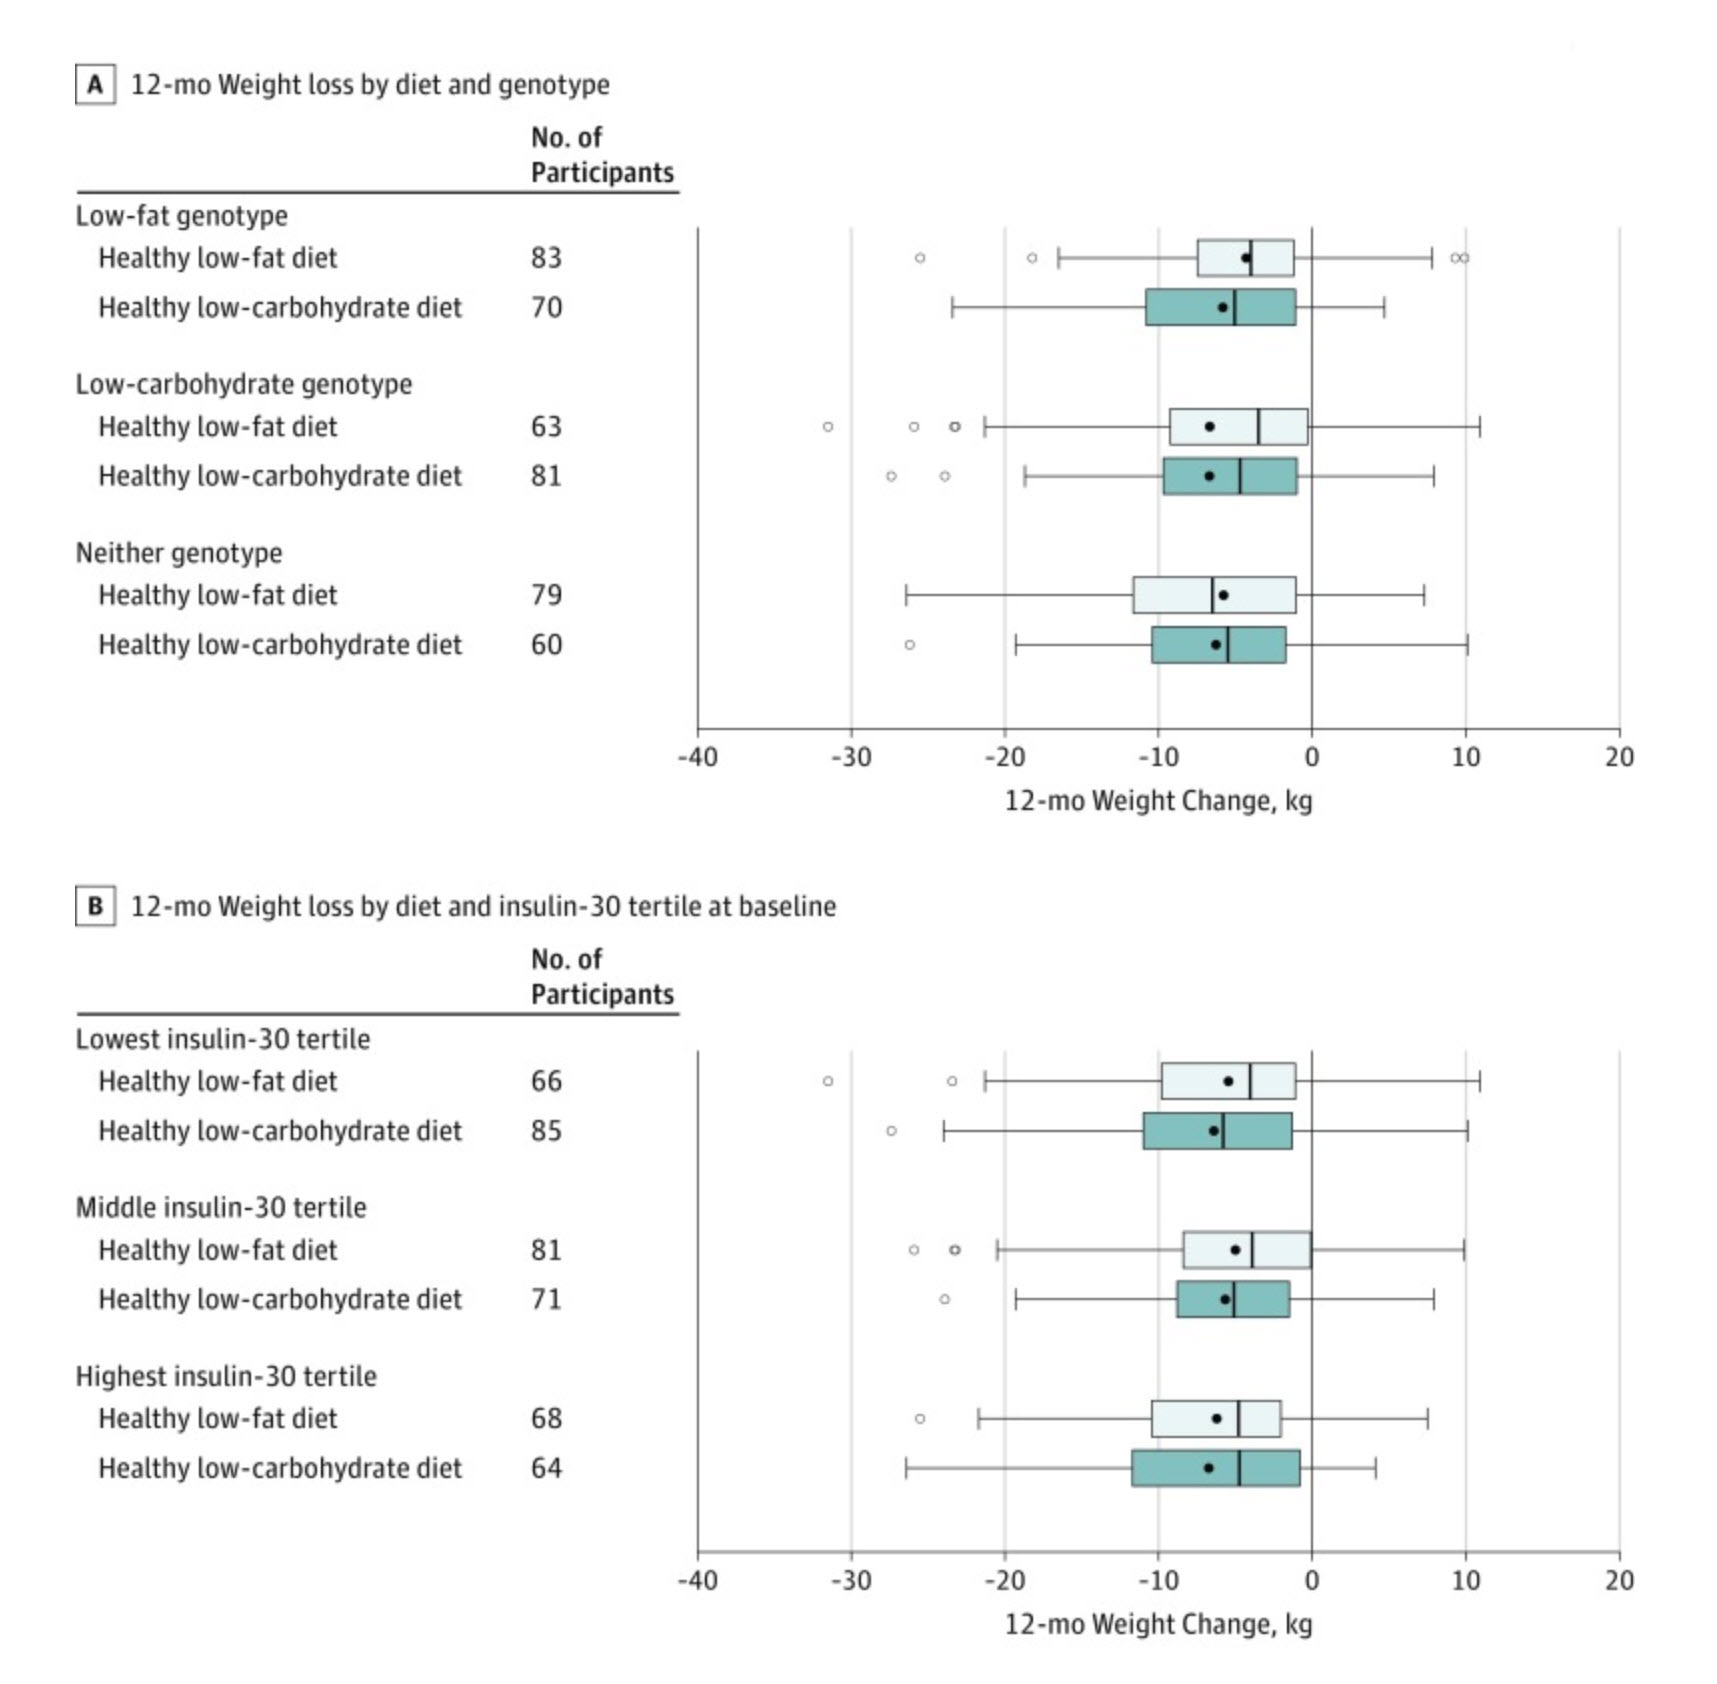
- Weight change at 12 months was −5.3 kg for the HLF diet vs −6.0 kg for the HLC diet (mean between-group difference, 0.7 kg [95% CI, −0.2 to 1.6 kg]).
- However, there were no significant between-group differences observed for body mass index, body fat percentage, and waist circumference
- There was no significant diet-genotype pattern interaction or diet-insulin secretion interaction with 12-month weight loss. Gardner also comments that this study is the highest quality assessment of the studied gene-diet interactions to date. It attempted to corroborate previous observations, but in a more rigorous setup was unable to do so.
- This indicates that there was no significant difference in weight change among participants matched vs mismatched to their diet assignment based on their 3-SNP genotype pattern
- The test for interaction among diet, baseline insulin secretion (INS-30), and the 12-month time point was not statistically significant. [22]
- Adverse events were similar between groups
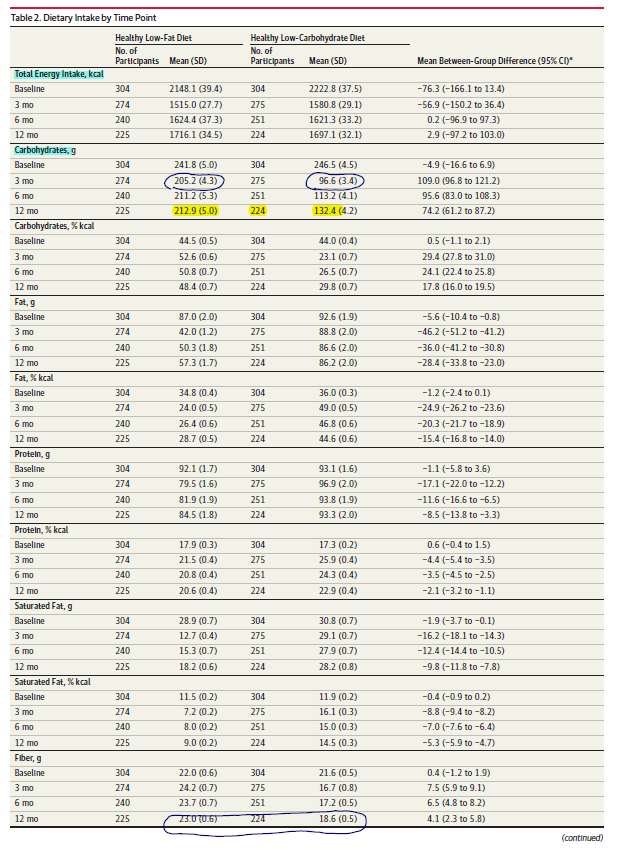
- Total energy intake was not different between diet groups at baseline or at any subsequent time point.
- But, both groups did reduce their calorie intake.
- Despite not being instructed to follow a specific energy (kilocalorie) intake restriction, the mean reported energy intake reduction relative to baseline was approximately 500 to 600 kcal/d for both groups at each time point after randomization.
- As you can see below, the largest difference in the carb and fat intake between groups was seen at 3 months but did remain quite different at 12 months. There was roughly an 80-gram difference in carb intake between groups, but even the high-carb group reduced their carb intake relative to baseline.

- As noted in many previous studies, a low-carb diet increases LDL but is also favorable for HDL and triglycerides.
- At 12 months relative to baseline, both diets improved lipid profiles and lowered blood pressure, insulin, and glucose levels, with the exception of low-density lipoprotein cholesterol concentrations, which increased for participants in the healthy low-carbohydrate group (Table 3). The 12-month changes in low-density lipoprotein cholesterol concentrations significantly favored a healthy low-fat diet.
- High-density lipoprotein cholesterol concentrations increased significantly more and concentrations of triglycerides decreased significantly more for the healthy low-carbohydrate diet group than for the healthy low-fat diet group.
Authors Conclusion:
- In this 12-month weight loss diet study, there was no significant difference in weight change between a healthy low-fat diet vs a healthy low-carbohydrate diet, and neither genotype pattern nor baseline insulin secretion was associated with the dietary effects on weight loss. In the context of these 2 common weight loss diet approaches, neither of the 2 hypothesized predisposing factors was helpful in identifying which diet was better for whom.
Interesting Notes:
- Gardner rightly points out, as do I in Healthy Gut, Healthy You, that the effective size difference between low-carb and low-fat diets is minimal.
- Most diet trials have reported modest (ie, <5%) mean weight loss after 12 months and negligible mean weight loss differences between diet groups.
- The three gene polymorphisms that previously displayed predictive power regarding macronutrient content were; PPARG (rs1801282), ADRB2 (rs1042714), and FABP2 (rs1799883).
- In a preliminary retrospective study, a 3-fold difference was observed in 12-month weight loss for initially over-weight women who were determined to have been appropriately matched (mean weight loss of 6 kg) vs mismatched (mean weight loss of 2 kg) to a low-fat or low-carbohydrate diet based on multilocus genotype patterns with single-nucleotide polymorphisms (SNPs) from 3 genes (PPARG, ADRB2, and FABP2) relevant to fat and carbohydrate metabolism (a putative low-fat–responsive genotype and a low-carbohydrate–responsive genotype).
- Reports were published (12,13,23,24) indicating INS-30 was a successful predictor of weight loss in the context of low-carbohydrate diets or similar diets
- Gardner was looking to see if baseline insulin sensitivity predicted if one would do better on low-carb versus low-fat. Based on previous observations supporting this position:
- For example, individuals with greater insulin resistance may have better success with low-carbohydrate diets due to the decreased demand on insulin to clear a lower amount of dietary carbohydrate delivered to the circulation. However, these studies were limited by relatively small sample sizes or post hoc analyses of the results.
Clinical Takeaways:
- A healthy low-carb diet is similar in its effect as a healthy low-fat diet.
- Previous studies on a low-fat diet may have shown unfavorable results due to allowing refined grain consumption.
- Either diet can work. Use the patient preference and what they feel best on.
Dr. Ruscio Comments
I will be releasing a podcast interview with Dr. Gardner expanding on this study soon. This is yet another data point reinforcing why it is important to be open-minded regarding diet and to help guide a patient to whatever diet they feel best on. Some do better low-carb, while others do better high-carb. Listen to the patient’s response, in addition to improving their gut health, and the optimum dietary approach will reveal itself with time.
Assessment of Anti-Vinculin and Anti-Cytolethal Distending Toxin B Antibodies in Subtypes of Irritable Bowel Syndrome
https://www.ncbi.nlm.nih.gov/pubmed/28451914
Study Purpose
- To determine whether these antibodies can also diagnose and differentiate other IBS subtypes.
Intervention:
- Healthy subjects without gastrointestinal (GI) diseases or symptoms (n = 43) and subjects with mixed IBS (IBS-M) (n = 25) or IBS with constipation (IBS-C) (n = 30) were recruited from two major medical centers.
- Plasma levels of anti-CdtB and anti-vinculin antibodies in all subjects were determined by enzyme-linked immunosorbent assay.
Main Results:
- CdtB antibodies can diagnose IBS-D but are no different in IBS-C than in healthy controls
- Plasma levels of anti-CdtB and anti-vinculin antibodies were highest in IBS-D and lowest in IBS-C and healthy controls (P<0.001).
- Positivity for anti-CdtB or anti-vinculin resulted in a statistically significant negative gradient from IBS-D (58.1%) to IBS-M (44.0%), IBS-C (26.7%), and controls (16.3%) (P<0.001).

- The sensitivities of these antibodies are modest but specificity guards against false positives.
- The sensitivities of the antibodies to detect IBS-M or IBS-D are modest at 44 and 58%, respectively. However, it should be noted that the pathophysiologic processes underlying IBS are heterogeneous and biomarkers to rule in IBS will naturally have modest sensitivities at best. Moreover, given the high prevalence of IBS, biomarker cutoffs are selected to target a higher specificity to lower false positive rate which further sacrifices the sensitivities.

Limitations:
- We still don’t know how to treat these antibodies.
- We did not assess the role of these antibodies as predictors of response to IBS therapy
Authors Conclusion:
- “Anti-CdtB and anti-vinculin titers and positivity rates differ in IBS subtypes, with higher antibody levels and positivity rates in IBS-D and IBS-M, and lower levels in IBS-C subjects that are similar to those in healthy controls. These antibodies appear useful in the diagnosis of IBS-M and IBS-D, but not IBS-C. Furthermore, these findings suggest that IBS-C is pathophysiologically distinct from subtypes with diarrheal components (i.e., IBS-M and IBS-D).”
Interesting Notes:
- Irritable bowel syndrome (IBS) is a chronic gastrointestinal (GI) condition that affects approximately 5–15% of the population worldwide [1,2,3]. Symptoms include abdominal pain and discomfort, bloating, urgency, and changes in bowel habits.
- As we have discussed prior, the main utility of the CdtB/vinculin testing is to distinguish IBS-diarrhea from celiac and IBD. This could lead to significant time and cost savings for patients.
- IBS patients frequently undergo costly, time-consuming and invasive investigations to rule out alternative causes of IBS-like symptoms.
- Furthermore, in a large scale clinical study, anti-CdtB, and anti-vinculin titers were significantly higher in patients with IBS-D than in patients with IBD, celiac disease, and healthy subjects (all comparisons, P<0.001, 10).
- Anti-CdtB levels [optical density (OD) ≥ 80] differentiated IBS-D from IBD with sensitivity, specificity, and positive likelihood ratio of 43.7%, 91.6% and 5.2, respectively. Using anti-vinculin levels (OD ≥ 1.68), the sensitivity, specificity, and likelihood ratio were 32.6%, 83.8%, and 2.0, respectively.
- Gut infections can initiate IBS.
- The most common bacterial pathogens that cause IGE are gram-negative bacilli such as Campylobacter jejuni, Salmonella, Escherichia coli, and Shigella [20,21,22,23]. The Cdt toxin is commonly produced by all of these pathogens and is composed of three subunits, CdtA, CdtB, and CdtC, of which CdtB is the active subunit and appears to play a major role in the development of post-infectious IBS symptoms (11, 24).
- Constipation type IBS may be a different disease than diarrheal or mixed type IBS
- CdtB antibodies as a diagnostic marker for IBS-D has been verified in other studies, but still requires further validation.
- Recently, Schmulson et al. [33] published a study of a well-characterized group of Mexican patients with IBS-D, IBS-M, and functional diarrhea. Anti-CdtB or anti-vinculin positivity was identified in 50% of IBS-D subjects and in 33% of IBS-M subjects. Our results indicate a 58% positivity rate for IBS-D subjects and a 44% positivity rate for IBS-M subjects, a similar percentage, and gradient to those identified by Schmulson et al.
- This supports the hypothesis that the positivity rates for these antibodies are independent of geographic location. However, this concept requires further validation in other continents.
Clinical Takeaways:
- CdtB and vinculin antibody testing show promise as a diagnostic marker for IBS-D but not for IBS-C.
- Further research is required to validate this finding and to establish how this marker should be used in clinical practice.
Dr. Ruscio Comments
Great to see more data validating this marker, and clarifying it’s potential limitations to a certain IBS subtype. Remember as exciting as this test is, how to use this in clinical practice still requires elucidation.
Ferritin & Hypothyroid – Multiple Nutritional Factors and Thyroid Disease, with Particular Reference to Autoimmune Thyroid Disease.
https://www.ncbi.nlm.nih.gov/pubmed/30208979
Study Purpose
- This study overviewed the nutritional factors in hypothyroidism. Most of this was nothing new, but there was one statement regarding ferritin that I felt deserved investigation.
- AITD patients are frequently iron-deficient since autoimmune gastritis, which reduces iron absorption and coeliac disease which causes iron loss, are frequent co-morbidities. In two-thirds of women with persistent symptoms of hypothyroidism despite appropriate levothyroxine therapy, restoration of serum ferritin above 100 µg/l ameliorated symptoms.
Intervention:
- I investigated this claim to decipher how important achieving ferritin above 100 is.
Main Results:
- Essentially, the main support for the above claim comes from the below references, a poster presentation. This poster presentation did find that restoring ferritin to 100 alleviated symptoms in roughly 75% of women who were non-responsive to levothyroxine in a small study of 25 females.
- *Poster 179* Iron deficiency is the main cause of symptom persistence in patients treated for hypothyroidism. In 15th International Thyroid Congress, Thyroid 25, A–74.
- Here is the abstract from this study
- Symptoms of hypothyroidism (HT) persist in 5–10% of hypothyroid patients treated with levothyroxine (L-T4). These patients are a clinical challenge and are often difficult to treat or unresponsive to combination treatment with L-T4 and L-T3. The prevalence in the population of iron deficiency is as common as HT. Symptoms of iron deficiency (ID) are identical to the symptom spectrum of HT. However, diagnosing iron deficiency may be extremely challenging, since iron stores may be severely depleted without any changes in the blood hemoglobin concentration or red cell indices. Patients with ferritin concentrations up to 70 mg/l may, in fact, be severely iron deficient.
- Twenty-five females with a history of overt HT were referred after appropriate and ongoing treatment with L-T4 for persisting hypothyroid symptoms. After careful clinical examination B12-vitamin deficiency, celiac disease, hypercalcemia, and vitamin D deficiency were excluded. Their L-T4 dose was adjusted when necessary to achieve a TSH concentration of 1–2 mU/l.
- 4/5 and 14/20 of the patients with serum ferritin <15 and 15–60 mg/l, respectively, became symptom-free after oral iron substitution therapy for 6–12 months; now their serum ferritin concentration was at least 100 mg/l. The functional iron stores may be depleted while the serum ferritin concentration is within the current reference ranges. Iron deficiency is apparently one of the main causes of persisting hypothyroid symptoms during thyroxin treatment. Not all iron deficient patients, however, seem to respond to the restoration of their functional iron stores.
- Iron deficiency simulates symptoms of hypothyreosis.
- Soppi, the author of the poster study, also made the following comments
- Poster 179 Disorders of Thyroid Function Monday & Tuesday Poster Clinical 9:00 AM IRON DEFICIENCY IS THE MAIN CAUSE OF SYMPTOM PERSISTENCE IN PATIENTS TREATED FOR HYPOTHYROIDISM. Soppi
- Symptoms of iron deficiency (ID) are identical to the symptom spectrum of HT. However, diagnosing iron deficiency may be extremely challenging, since iron stores may be severely depleted without any changes in the blood hemoglobin concentration or red cell indices.
- Patients with ferritin concentrations up to 70 mg/l may, in fact, be severely iron deficient.
- The main paper (not the poster) also comments that the reason 5-10% of women do not fully respond to levothyroxine could be due to low iron. So, perhaps ferritin should be checked before moving to a T4+T3 combination medication.
- Body iron stores, calculated from blood Hb concentration, mean corpuscular volume, serum ferritin, and transferrin receptor were highly significant predictors of TSH and total T4 (P < 0.0001, 55).
- It is important to recognize that low iron stores may contribute to symptom persistence in patients treated for hypothyroidism in 5–10 % of whom symptoms remain despite being treated with levothyroxine (L-T4)(57).
- In those with SCH, thyroid hormone does seem to enhance the effect of iron supplementation.
Additional Results:
- A few interesting quotes from other papers
- Iron deficiency without anemia – a clinical challenge. Soppi ET.
- One should always consider iron deficiency (without anemia) as the cause of persisting, unexplained unspecific, often severe, symptoms, regardless of the primary underlying disease. The symptoms of iron deficiency may arise from the metabolic systems where many proteins are iron-containing. Long-standing iron deficiency may be challenging to treat.
- Hematological disturbances in subclinical hypothyroidism and their dynamics during substitution therapy. Klin Med (Mosk) 91, 29–33. [Article in Russian]
- Essentially found levothyroxine improved anemia and ferritin on those with SCH
Limitations:
- There is limited data to support this contention, only one data set from a poster presentation. However, when considering that autoimmune gastritis and SIBO are more frequent in those with hypothyroid, it strengthens the plausibility. Also, when considering the intervention here is a dietary supplement, iron, it is fairly easy to substantiate.
Clinical Takeaways:
- Consider checking ferritin in all hypothyroid or SCH patients
- Strongly consider checking ferritin in those not responding to levothyroxine
- Supplementing ferritin to >100 may alleviate symptoms in 75% of recalcitrant hypothyroid patients
- I have amended the thyroid Rx algorithm in light of this, see below
Dr. Ruscio Comments
Three primary considerations (beyond diet/lifestyle) in those not responding to T4 therapy: gut health, iron anemia, and poor conversion.
Thyroid Algorithm Update
Here is my updated thyroid hormone algorithm, based on the above:
- 1a: Stand/tablet LT4 trial, with dose adjustments
- Note: don’t forget to check compliance (is the patient missing doses) and that the medication is being taken on an empty stomach
- 1b: Optimize gut health & general health
- 1c: consider screening for and treating low ferritin (low=below 100)
- 2a: Screen for/treat low ferritin
- 2b: considerably higher than normal LT4 dose, perhaps guided by dialysis/LC-MS, targeting TSH in lowest ½ of the acceptable range
- 3: Depends on history/context
- consider a trial on hypoallergenic tablet LT4+LT3 (Nature Thyroid, WP Thyroid)– levels responding but symptoms not, and/or reactions occurring
- or, trial on liquid LT4– levels not fully responding
- 4: Consider the trial addition of T3
I’d like to hear your thoughts or questions regarding any of the above information. Please leave comments or questions below – it might become our next practitioner question of the month.

Like what your reading?
Please share this with a colleague and help us improve functional medicine
Discussion
I care about answering your questions and sharing my knowledge with you. Leave a comment or connect with me on social media asking any health question you may have and I just might incorporate it into our next listener questions podcast episode just for you!